
The short answer: treat moisture haze as a measurable, recoverable process
When transparent antistatic ABS becomes hazy in a humid environment, the material has not suddenly lost its inherent transparency. Water has temporarily changed the optical uniformity of internal microdomains. Drying drives that water out; the domains contract, the refractive-index difference narrows and clarity returns. Production teams can distinguish reversible moisture conditioning from a real defect by comparing data before exposure, after exposure and after recovery.
This approach is especially useful for a transparent, permanently antistatic grade such as DGK-ABS KJD890TM. Its data sheet establishes a surface resistivity of 10⁸–10¹⁰ Ω/□, a heat-deflection temperature of 85°C at 0.45 MPa and a molding-dry starting point of 85°C for 4–5 h. Add transmission, haze and humidity conditioning to those known values, and the result is a practical production specification.
Monsoon-season case: haze after 72 h, clarity restored in 4 h
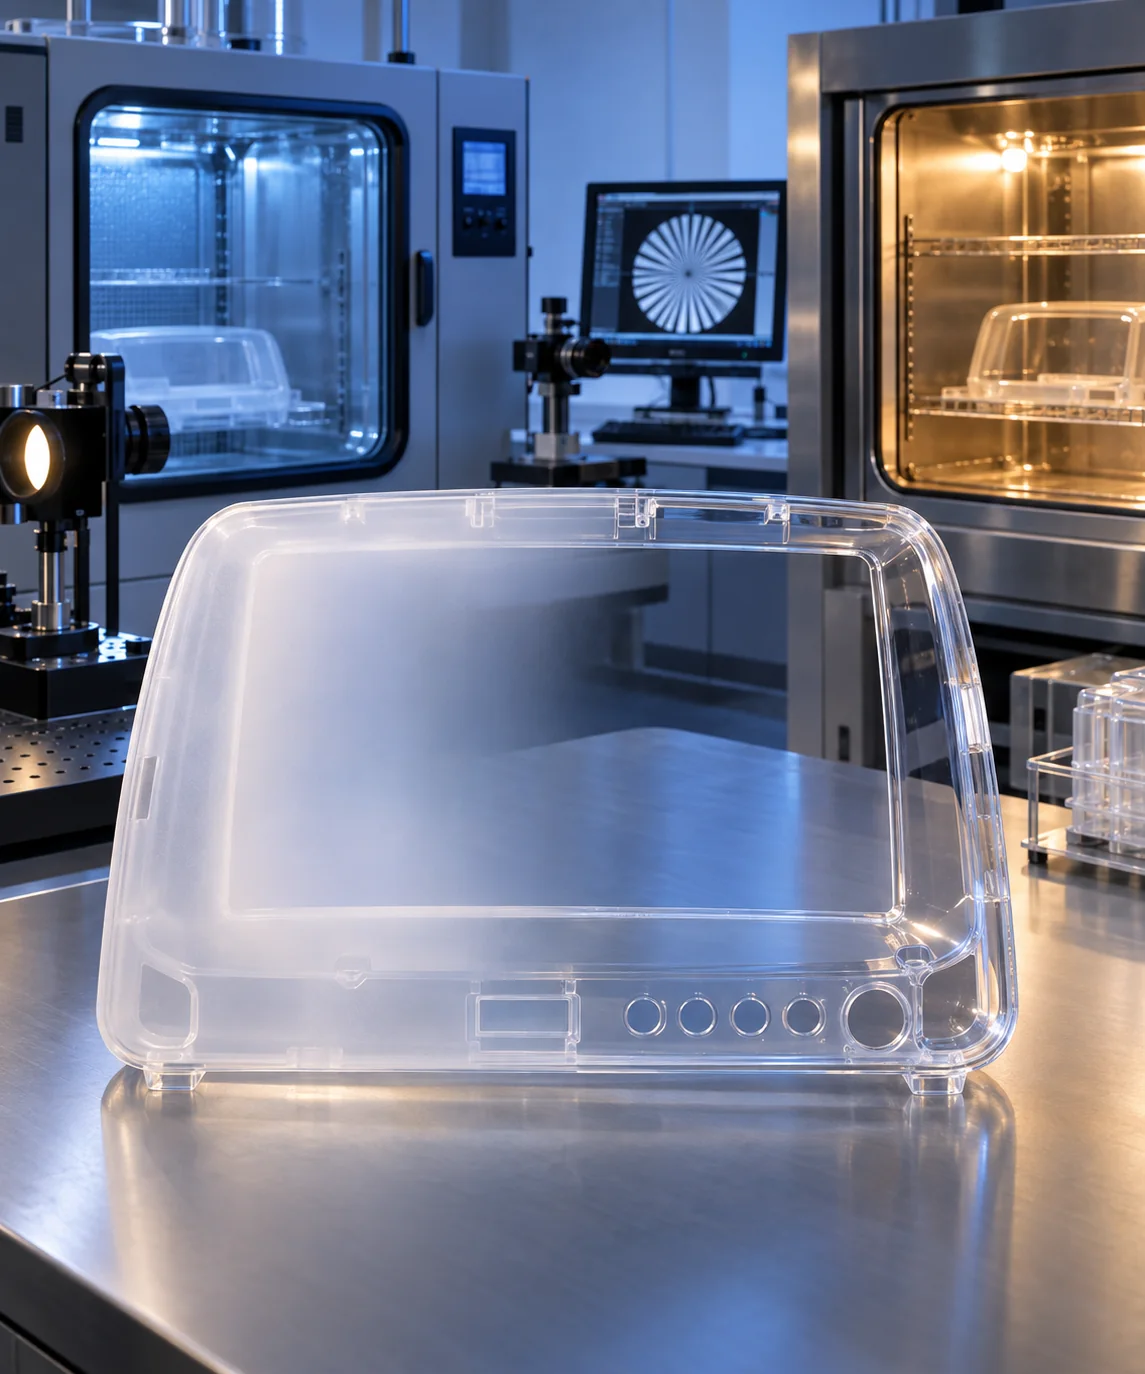
During last year's monsoon season, a medical-monitor panel molder found that a lot of transparent covers became visibly hazy after 72 h in warehouse storage. The 2 mm parts were molded from DGK-ABS KJD890TM. The project acceptance targets were at least 85% light transmission and less than 6% haze. Parts were clear and dimensionally sound at the press, but developed an even milky cast three days later. Quality initially prepared to quarantine the lot as scrap.
We checked four clues first: whether opened resin bags had been resealed, warehouse temperature and humidity, how the molded covers were stacked, and whether the haze was uniform or localized. There were no splay marks, bubbles, flow lines or surface scratches. The haze covered the viewing area evenly and became more apparent at higher humidity. Those observations pointed to post-molding moisture uptake, not barrel moisture or a mold-replication defect.
Twelve parts from the lot were sampled. The team recorded initial mass, five-position haze, transmission and critical dimensions, then placed the parts flat in a hot-air oven at 85°C. One group was removed every hour, cooled to room temperature in a sealed dry box and retested. The milky appearance started receding after 3 h. At 4 h, transmission was again above 85%, haze was below 5%, the viewing area was clear and all critical dimensions remained within assembly tolerance.
That recovery returned a suspected scrap lot to the acceptance range and gave the customer a permanent operating method. Warehouse humidity was logged through the wet season, opened resin was double-sealed, and any uniformly hazed molded part received an 85°C recovery test before release. The same method succeeded on the next two production lots, making disposition faster and giving production and quality one shared set of evidence.
How water enters ABS—and why a 2 mm part can change after tens of hours
The polar nitrile groups in ABS give the polymer measurable affinity for atmospheric moisture. A NIST absorption and desorption study on 3D-printed ABS measured a water diffusion coefficient of 8.3 × 10⁻⁸ cm²/s at 23.2°C, with a gravimetric cross-check within about 3%. At 22.2°C and 57% RH, at least 80% of the absorbed atmospheric gas was water and total uptake was about 0.35 wt%.
Those values are not grade-specific data for KJD890TM, but they give a useful ABS time scale. A 2 mm wall absorbs from both faces, so the half-thickness is 0.1 cm. Using t≈L²/D gives a characteristic time of about 33 h, while fuller equilibration takes longer. A visible change after 48–72 h is therefore consistent with diffusion physics.
Optical change can appear before moisture equilibrium. A transparent part does not need to be fully saturated: haze rises as soon as local domains grow or their refractive-index contrast becomes large enough to scatter visible light. Wall thickness, relative humidity, part temperature, exposed area and stacking airflow all move that curve.

The haze mechanism: moisture temporarily disrupts refractive-index matching
Transparent ABS is commonly an MABS system. Its clarity depends on close refractive-index matching among the rubber phase, SAN matrix and modifier phases, plus a fine, uniform dispersion. The more optically uniform those internal interfaces are, the less visible light they scatter.
A permanent antistatic system creates a continuous route for charge dissipation inside the polymer. Polymeric antistatic phases of this type commonly contain hydrophilic or ionic segments. Incoming water preferentially associates with those regions, causing local swelling and a compositional change. The previously close refractive-index match is disturbed and scattering centers become larger. As the optical inhomogeneity enters a range that visible light can strongly interact with, weak Rayleigh behavior gives way to stronger Mie-type scattering and the part takes on a milky appearance.
This is why standard transparent ABS and transparent antistatic ABS do not necessarily follow the same haze curve at identical humidity. The antistatic phase provides persistent charge dissipation while making local water distribution more optically important. Humidity conditioning and recovery data turn that behavior into a specification instead of an uncontrolled defect.
Why drying works: desorption, domain relaxation and restored optical uniformity
Moisture uptake here is predominantly physical sorption. Hot air at 85°C creates a strong water-vapor concentration gradient from the part interior toward the surrounding air. As water reaches the surface and evaporates, antistatic microdomains contract and their refractive index and scale move back toward the dry state. Transmission rises and haze falls.
A KSAE study of moisture desorption in ABS and other automotive-lamp polymers found that the process can be described with Fick's second law and that diffusion coefficient versus temperature follows an Arrhenius relationship. Oven temperature and part thickness therefore set recovery time: higher temperature accelerates transport, while thicker walls take longer for center moisture to leave.
The 85°C value in the KJD890TM data sheet is its heat-deflection temperature at 0.45 MPa, not its glass-transition temperature. During an 85°C molded-part recovery, support parts flat and avoid fixture stress or local loads. Cool them in a dry environment before measuring optics and dimensions. That produces a clean recovery curve without confusing heat deformation with moisture behavior.
Production validation: put resin, molded parts and environment on one timeline
Wet pellets and post-molding moisture haze are different problems. Excess pellet moisture can vaporize in the barrel and create splay, bubbles, streaking and surface defects. A part that molded clearly and then developed uniform haze in humid storage more closely fits reversible post-conditioning. Track them separately and diagnosis becomes much faster.
| Stage | Sample and condition | Measurements | Purpose |
|---|---|---|---|
| Resin baseline | Sealed pellets and opened-bag remainder | Mass or moisture; packaging state | Establish moisture starting point |
| After drying | 85°C for 4–5 h | Moisture and pellet appearance | Create a stable molding condition |
| As molded | 2 mm parts from one shot sequence | Transmission, haze, resistivity, dimensions, appearance | Establish dry-state baseline |
| Humidity conditioning | Specified temperature/RH for 24/48/72 h | Mass, transmission, haze, resistivity | Plot moisture and haze development |
| Drying recovery | 85°C; sample hourly to 5 h | Retest all values after dry cooling | Confirm recovery rate and endpoint |
| Production confirmation | Three consecutive lots; fixed locations | Average, range and defect position | Convert the lab method into a lot standard |
For transparent ABS pellets, ≤0.05% is a clear production moisture target. Start KJD890TM trials with 85°C drying for 4–5 h, a 195–210°C injection range and a 70°C mold, then tune melt temperature, back pressure and cycle for the specific machine and geometry. Projects that also need resistance, transmission and wipe-durability evidence can reuse the sample grouping in our antistatic ABS resistance, optical and durability validation guide.

Five visual patterns that separate moisture, molding and irreversible damage
| Observed pattern | First diagnosis | Confirmation | Action |
|---|---|---|---|
| Uniform haze that grows with humid exposure | Post-molding moisture uptake | Timed 85°C recovery and haze retest | Release after recovery; improve sealed storage |
| Splay, streaks or bubbles present at molding | Insufficient pellet drying | Measure pellet moisture and compare dry lots | Restore drying and sealed transfer |
| Haze near the gate, flow end or wall transition | Shear, temperature or mold replication | Map molding parameters to flow direction | Tune melt/mold temperature, speed and venting |
| No recovery after 5 h; scratches or rainbow stress | Solvent, stress or mechanical damage | Cleaner comparison, polarized-light and surface check | Change cleaner, structure or process |
| Clarity returns but dimensions move | Thermal load or fixture stress | Review support and critical dimensions | Reduce load; optimize placement and cycle |
Put three numbers in the SOP: 0.05%, 48 h and 85°C × 4–5 h
0.05% controls pellet moisture before molding and reduces splay, streak and bubble risk. 48 h is a practical first management window for opened resin; double-seal any remainder with desiccant and shorten the window when wet-season mass data calls for it. 85°C × 4–5 h is both the KJD890TM pellet-drying start point and a useful recovery window for a supported 2 mm molded part.
Warehouse humidity, bag-opening time, drying batch and molded-part condition should share one traceability code. When haze appears, the team can immediately answer when moisture entered, how much haze changed, how long recovery took and whether dimensions moved. Full mechanical, electrical and molding data for DGK-ABS KJD890TM are available on the transparent antistatic materials data page.
Execution checklist: turn reversible optics into production capability
- Dry pellets before molding, target no more than 0.05% moisture, and record bag-opening and drying time.
- Build as-molded baselines for transmission, haze, surface resistivity, dimensions and appearance.
- Condition at 24/48/72 h so the shape of the moisture curve is visible.
- Support hazed parts flat at 85°C, sample hourly and cool sealed before retesting.
- Use 3–5 h as the first recovery window for a 2 mm part; extend it as wall thickness increases.
- Release only after clarity, resistivity and dimensions all return to the accepted range.
“Hazy when wet, clear when dry” comes from a temporary moisture-driven change in refractive-index matching and microdomain scale. Plot sorption and desorption, then place optical, electrical and dimensional results in one report. The behavior becomes predictable, recoverable and repeatable production knowledge.
Data basis: Case values come from production validation of a 2 mm medical-monitor cover. KJD890TM values follow the Clearastatic data sheet with units standardized as Ω/□, MPa, g/10 min, °C and h.